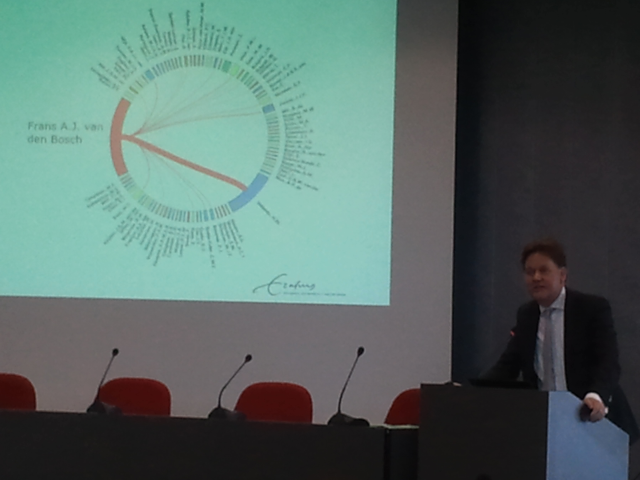
Presentation of the visualization at the farewell symposium in honor of Pr. van den Bosch
Presentation of the visualization at the farewell symposium in honor of Pr. van den Bosch
What:
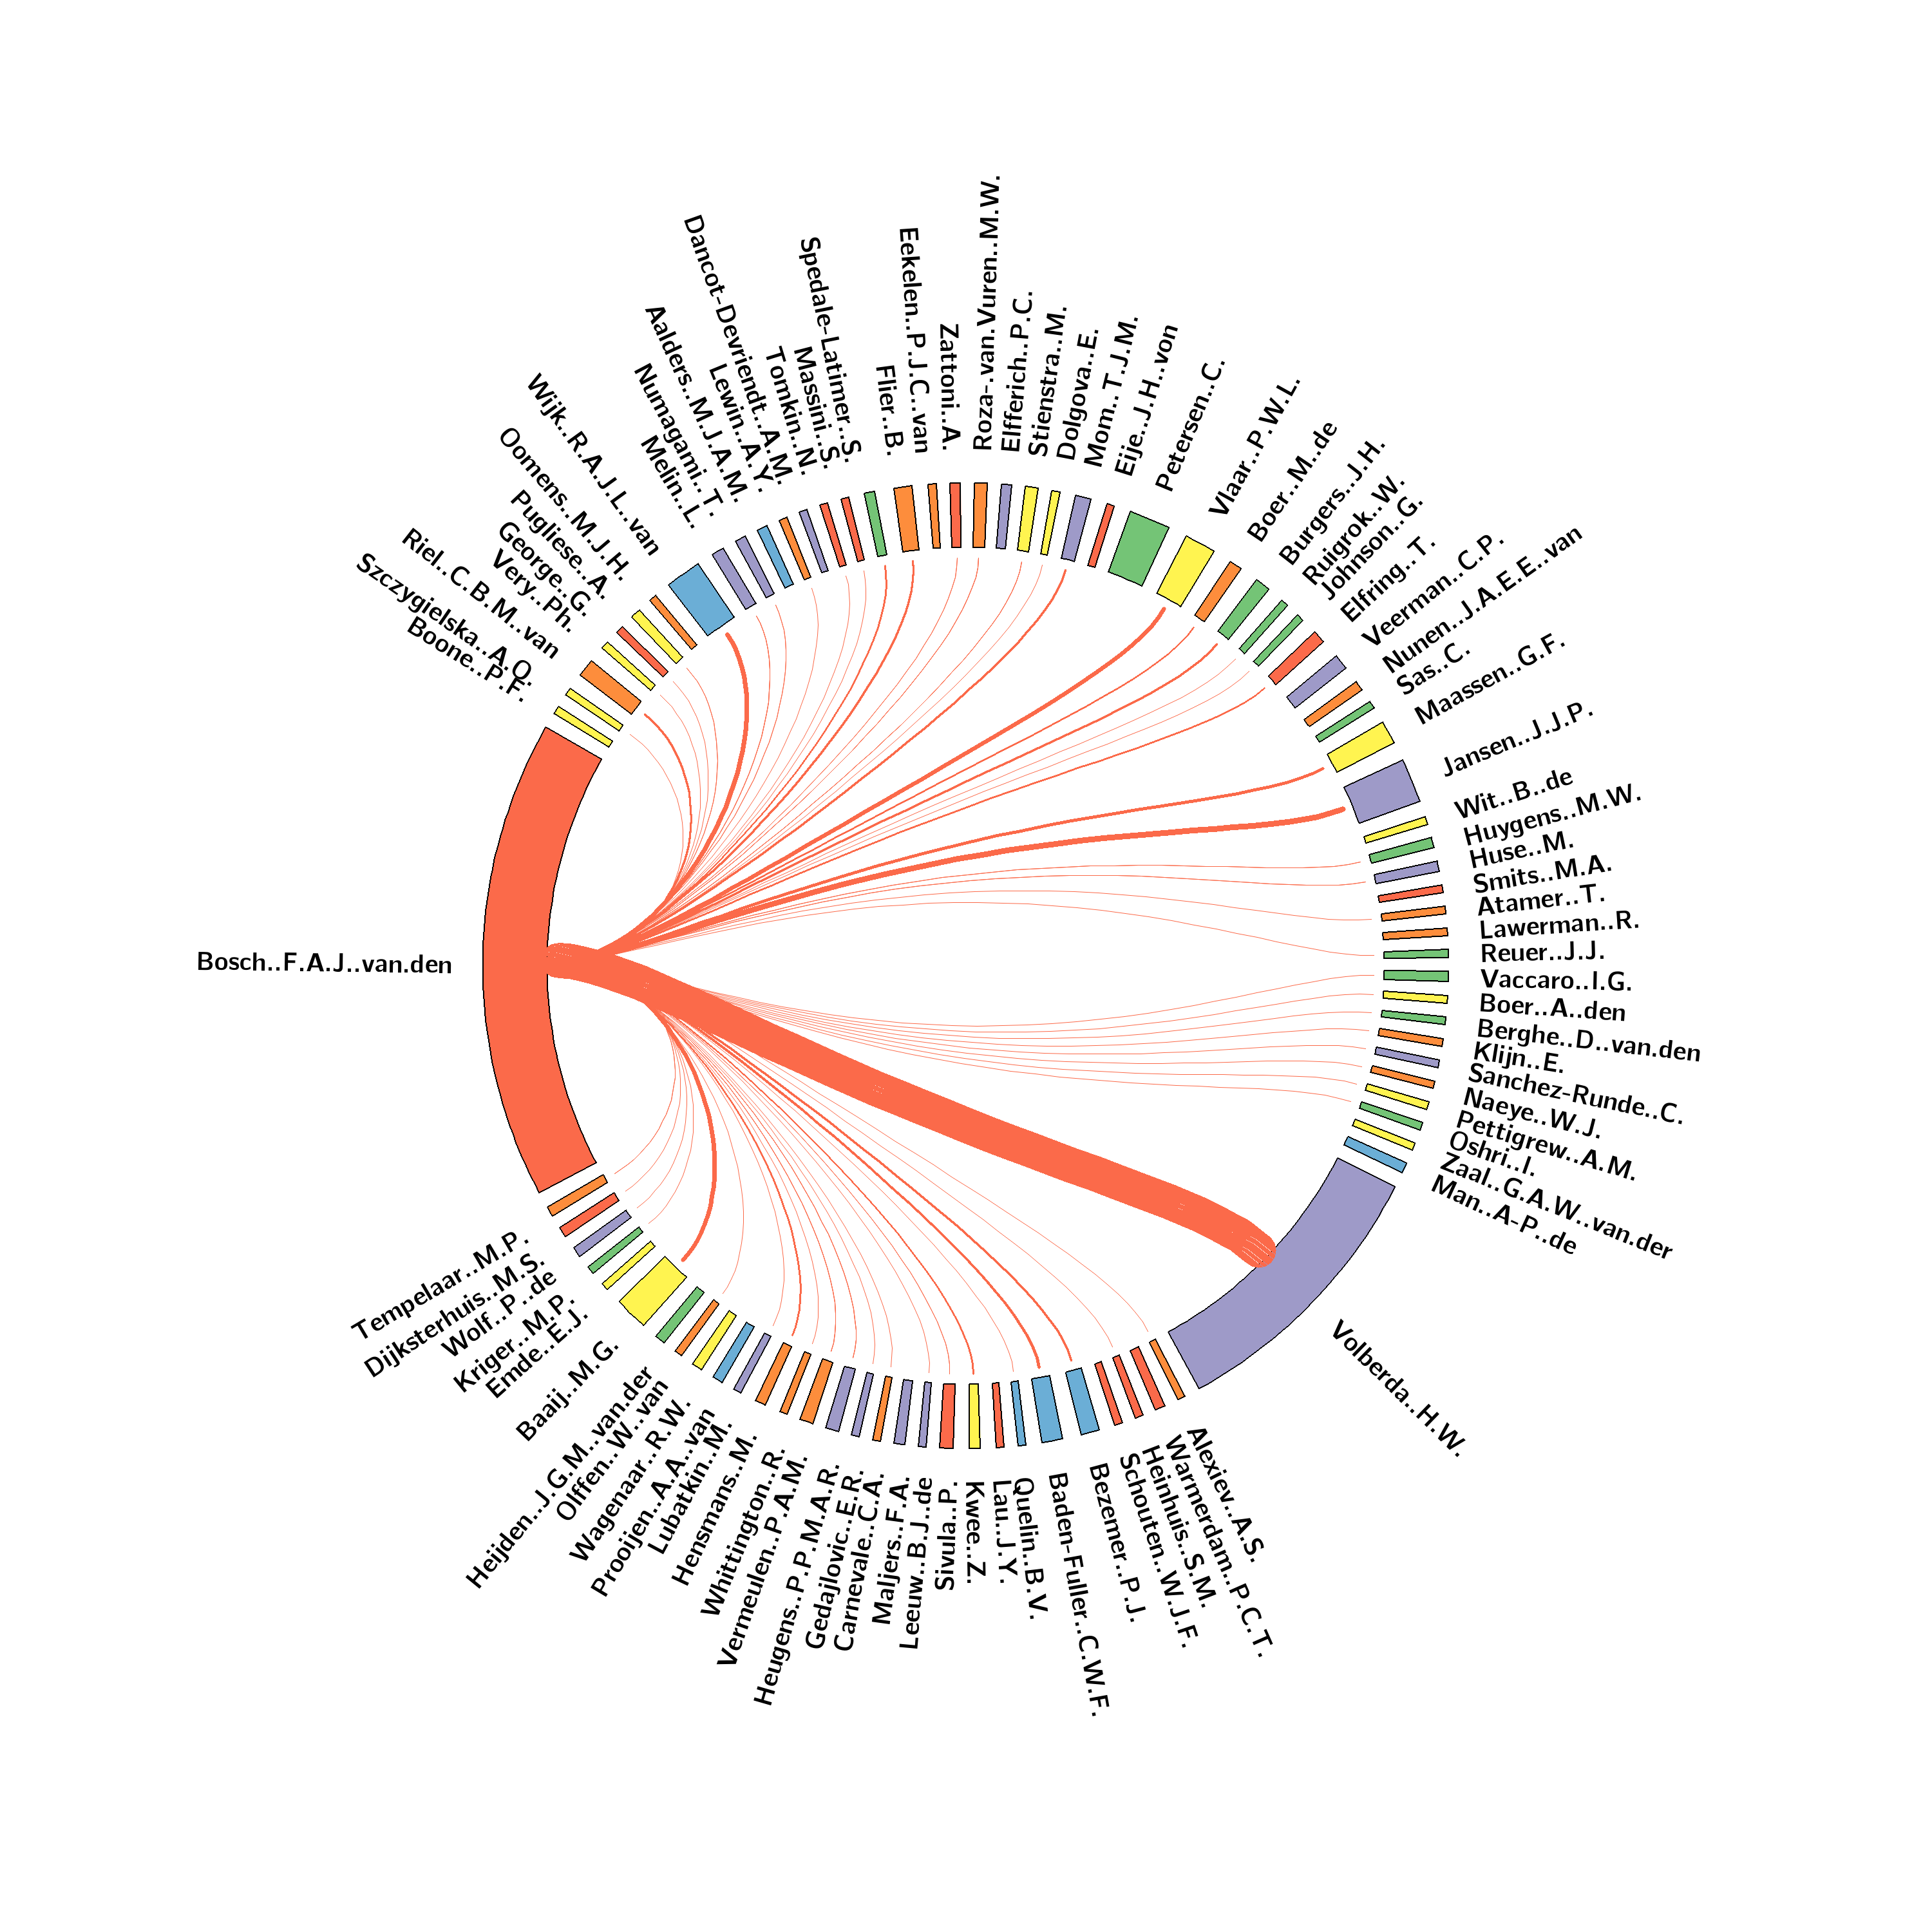
This is an evening project at the occasion of a symposium honoring Pr. Frans van den Bosch, a professor at my university
It shows all the co-authors of the professor, with the tickness of links corresponding to the number of co-authored publications
Visualization tool:
circos
Data source:
all the publications of the professor in a bibTex file
Processing:
I used Java to parse the bibTex file and generate the Circos configuration file. I implemented the possibility to select the publications restricted to a range of years
Impressions:
Circos makes indeed impactful visualizations. It is a real pain to configure (15+ config files, anybody?), but has an incredibly helpful debugger
Source code:
Github repository (the code is quite ugly as this was for a single night project!)
Higher res picture of the circle:
Click here for a better quality picture.
I'm Clement Levallois, and you can see my other projects here: clementlevallois.net